How to read a shot map
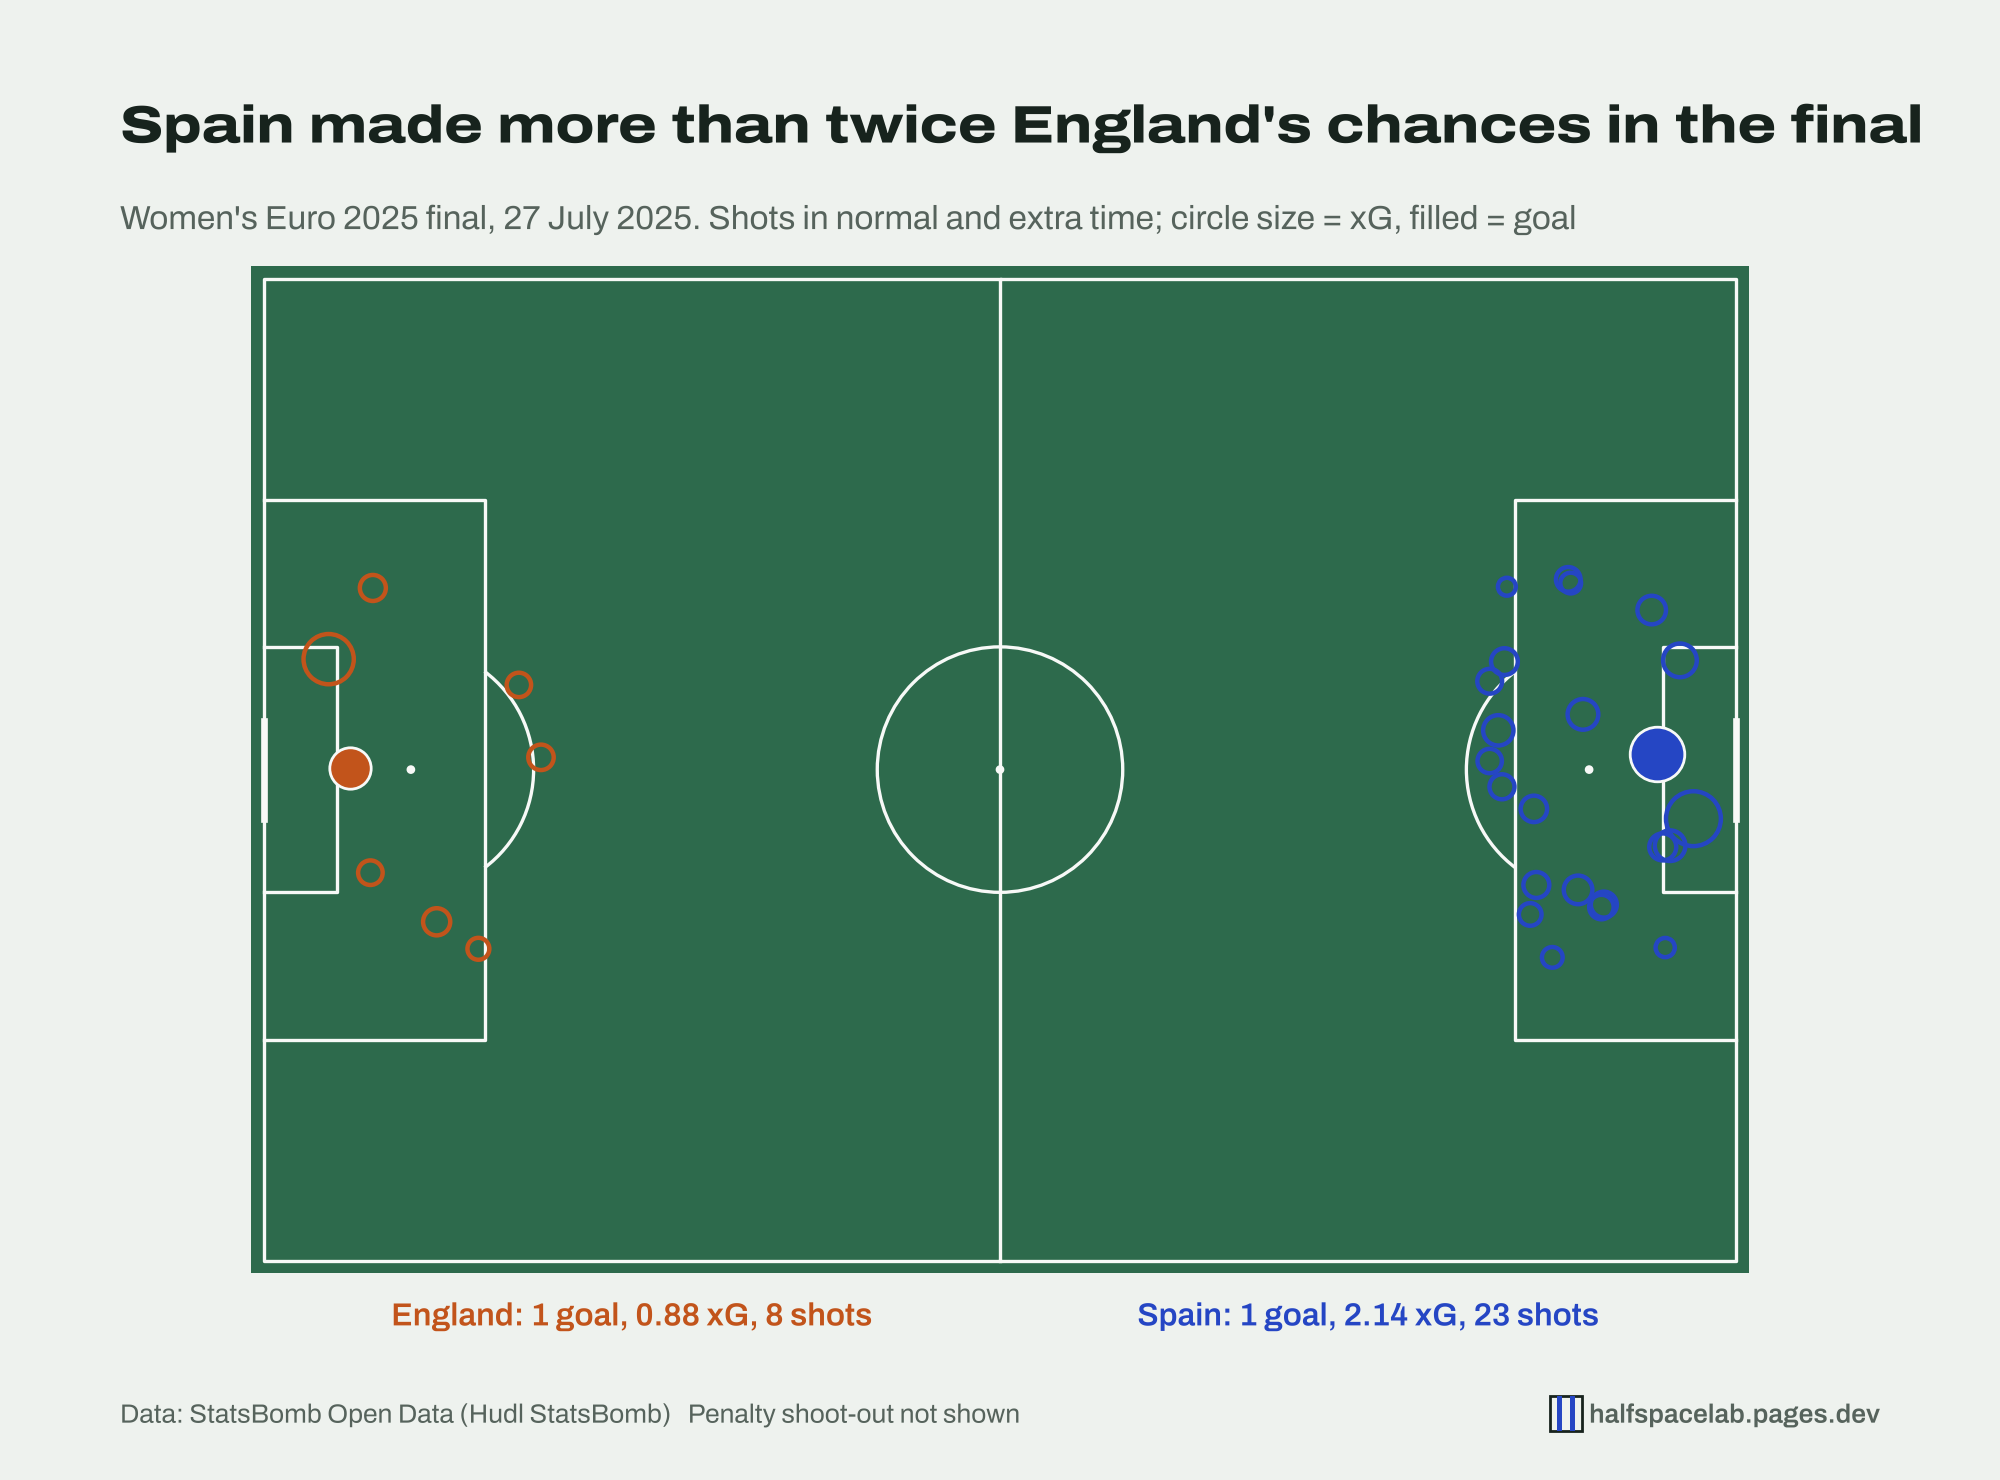
Where shots came from, how good they were and which went in, all on one pitch. The Euro 2025 final shows how much a shot map adds to a 1–1 scoreline.
The Women’s Euro 2025 final finished 1–1 after extra time, and England won the shoot-out. A scoreline like that hides almost everything about how the match went. A shot map shows it at a glance.
The four things to look at
1. Where the circles are. Each circle sits where the shot was taken. Here the two teams attack opposite goals so you can compare them side by side: England’s shots on the left, Spain’s on the right.
2. How big they are. Circle size shows xG, the quality of the chance (see what xG is). A big circle close to goal was a good chance; a dot from 25 yards was a hopeful one.
3. Which are filled. Filled circles are goals. Spain’s goal came from a first-half header worth 0.40 xG. England’s equaliser, also a header, was worth 0.21.
4. The totals underneath. Count the circles and add up their size: Spain took 23 shots worth 2.14 xG, England 8 worth 0.88.
What this one tells us
Spain’s circles crowd the penalty area: 17 of their 23 shots came from inside the box. They created more than twice England’s chance quality and scored only once from it. England took few shots but most of them, 6 of 8, were also from inside the box.
A fair reading is that Spain had the better of the chances over 120 minutes, and England took one of theirs and then won the penalties. That is not the same as saying Spain deserved to win: 2.14 xG against 0.88 still leaves plenty of room for a draw.
Things a shot map can’t show
- Chances without a shot. A dangerous cross that nobody reached doesn’t appear.
- When shots happened. Many shots in the final minutes while chasing the game look the same as shots spread evenly. Some shot maps add a timeline for this.
- Blocked shots. They are included here, but the map doesn’t distinguish them from shots that reached the goalkeeper.
Variations you’ll see
- Half-pitch maps for one team or one player, zoomed in on the attacking third.
- Colour by outcome (goal, saved, blocked, off target) instead of filled and empty.
- Season maps for a striker, showing where they shoot from over many games.
How this was made: every shot in normal and extra time of England v Spain, 27 July 2025, from StatsBomb Open Data. Penalty shoot-out kicks are not shown. “Inside the box” means shots taken from inside the penalty area.