What expected goals (xG) is, and what it isn't
xG puts a number on how good a chance was. At Women's Euro 2025 it tracked how often shots actually went in at almost every distance.
Two teams each score once. One had a single lucky deflection, the other spent ninety minutes carving open the defence. The scoreline says the game was even. Expected goals, or xG, is the tool that says it wasn’t.
The idea in one sentence
xG is the probability that a shot becomes a goal, based on how often similar shots have been scored in the past.
A shot with an xG of 0.30 is the kind of chance that goes in about 30 times out of 100. Add up the xG of every shot a team takes and you get its total xG for the match: roughly how many goals an average finisher would have scored from those chances.
What goes into it
Each data company builds its own model, trained on many thousands of past shots. The main ingredients are:
- Where the shot was taken: distance and angle to goal matter most.
- How it was taken: foot or head, volley or controlled shot.
- How the chance was created: through ball, cross, cut-back, set piece.
- The situation: StatsBomb’s model also uses where the goalkeeper and nearby defenders were at the moment of the shot.
Penalties are treated as their own case. In StatsBomb’s data every penalty carries the same value, 0.78.
Does it work?
Here is every non-penalty shot from Women’s Euro 2025, grouped by distance from goal. The grey bars show how often shots from each distance actually went in. The blue dots show the average xG the model gave those shots.
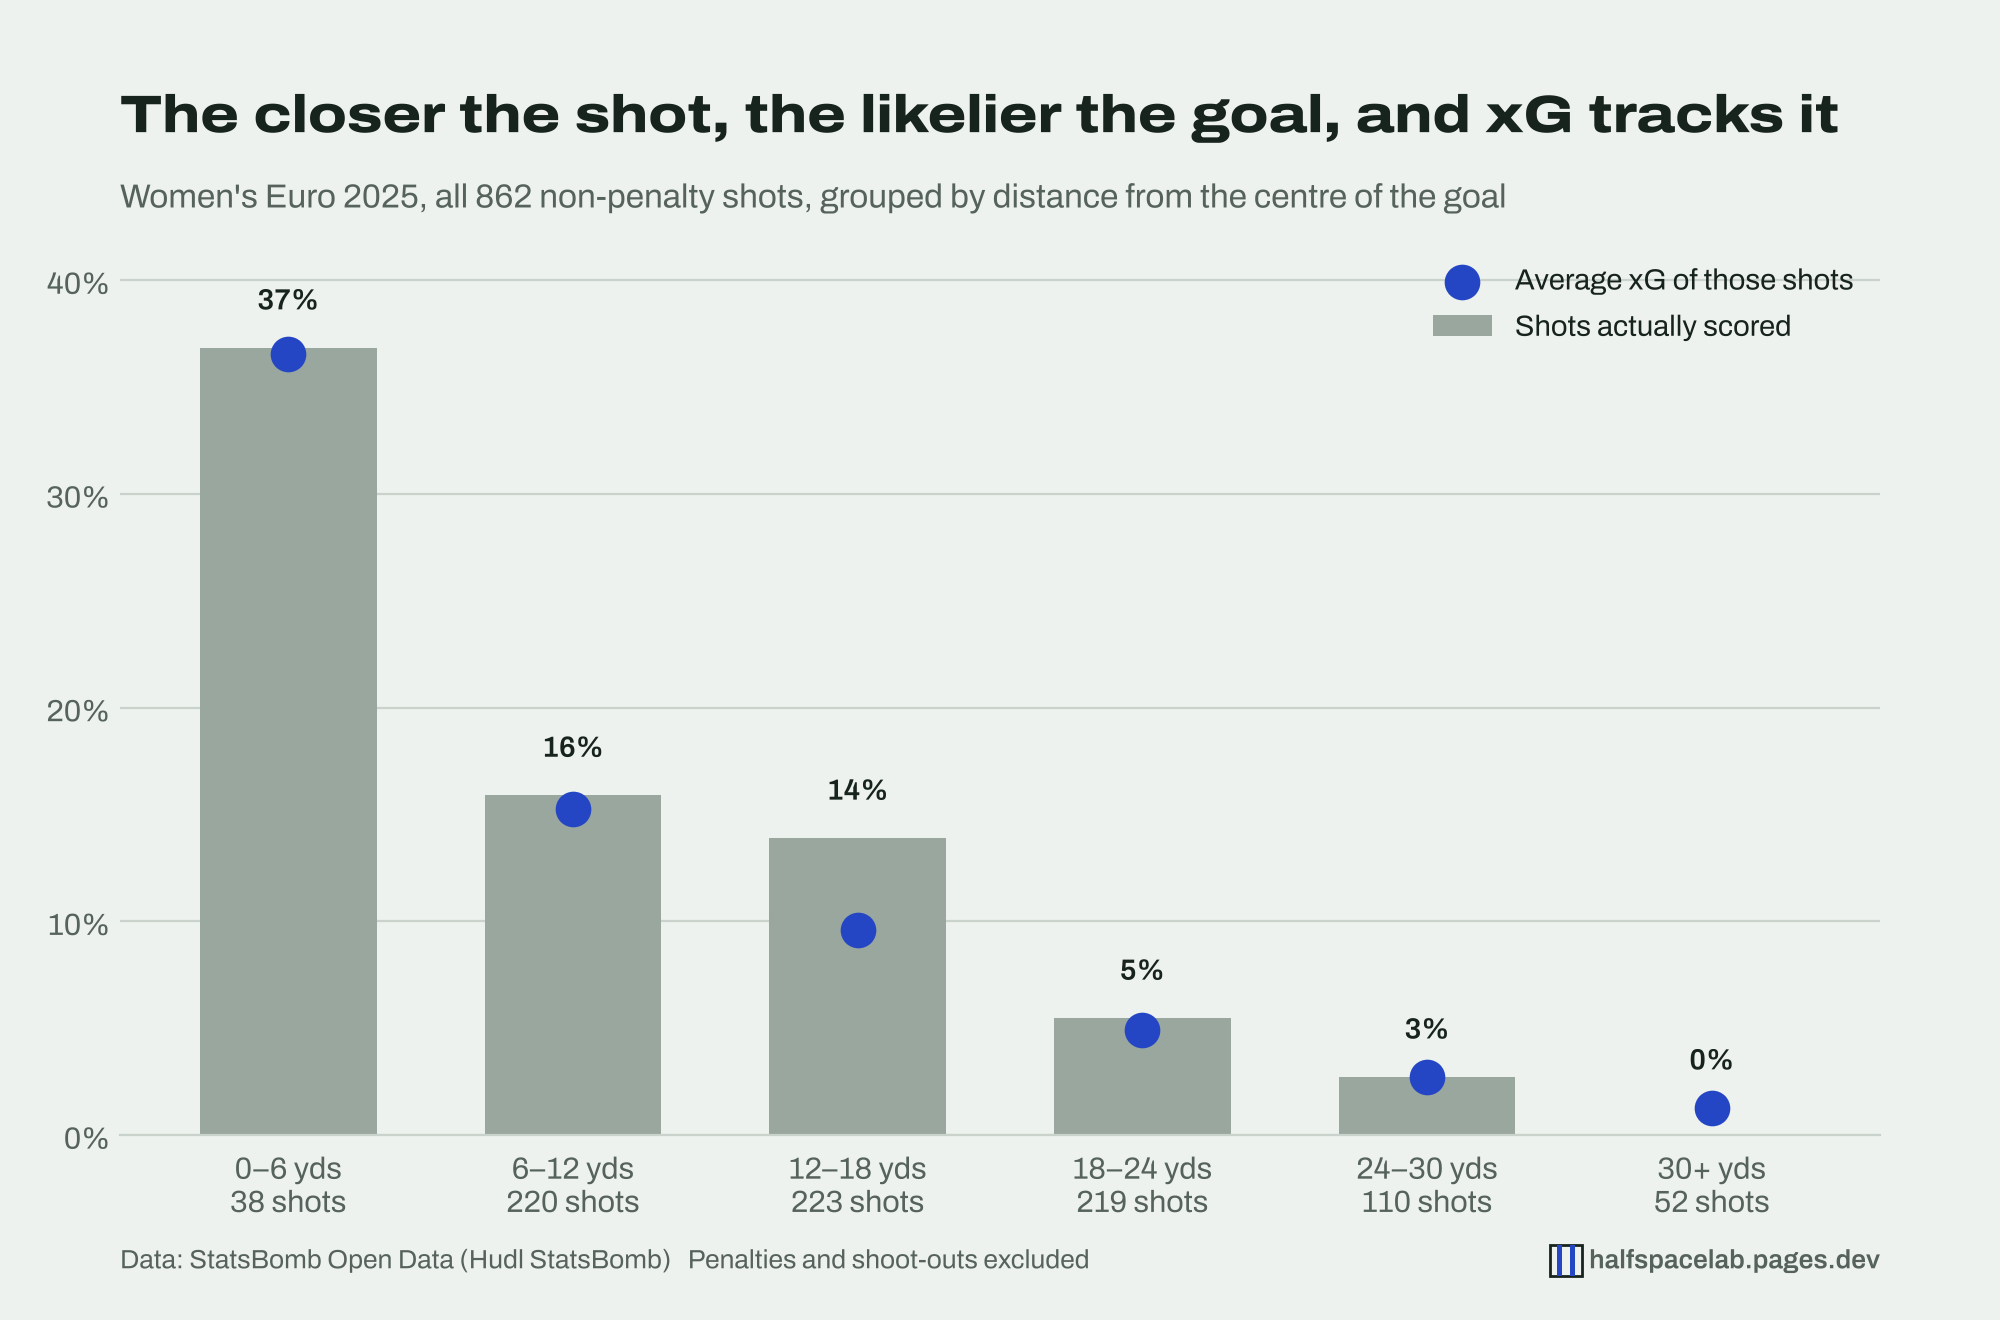
Two things stand out. First, distance changes everything: shots from inside six yards were scored 37% of the time, shots from 18 to 24 yards only 5%. Second, the dots sit close to the tops of the bars. Across the 862 non-penalty shots of the tournament the model expected 83.3 goals, and 95 were scored.
The one band where they part company, 12 to 18 yards, is a useful reminder: players there scored 14% of their shots against an average xG of 10%. That could be a run of fine finishing, or simply chance. Over 223 shots, a handful of extra goals is enough to open that gap.
What xG isn’t
- It isn’t a verdict on the result. A team can win the xG and lose the match, and over one game that happens all the time. xG tells you about the chances, not who deserved to win.
- It doesn’t judge the finish. xG is measured at the moment the ball is struck. A shot smashed into the top corner and one scuffed at the keeper from the same spot get the same value. (Post-shot xG, a separate metric, does look at where the shot went.)
- It misses chances without a shot. A cross that flashes across the six-yard box with nobody arriving produces no xG at all.
- It’s noisy in small samples. A striker five games into a season can be well above or below their xG by luck alone. The longer the stretch, the more the numbers mean.
- It differs between providers. StatsBomb, Opta and Understat each have their own models, so compare numbers from the same source.
How to use it
Treat xG as a description of chance quality. Over a whole season, a team creating far more xG than it concedes is usually a good team, whatever the table says this month. A team scoring far more goals than its xG may be finishing brilliantly, or may be due a quieter spell.
On this site, xG figures come from the model of the data source credited under each chart.
How this was made: all shots from the 31 matches of Women’s Euro 2025 in StatsBomb Open Data, excluding penalties and penalty shoot-outs. Distance is measured from the shot location to the centre of the goal, in yards (StatsBomb’s pitch units).